Coordinates in 3D Space
In SciChart, there is a possibility to configure the coordinate system which will be used by renderers. Could be one of the following;
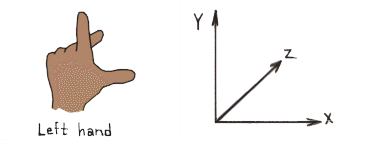
- Left Handed Coordinate System
- Right Handed Coordinate System
Be default SciChartSurface3D renders 3D world using the Left-Handed coordinate system - LHS.
In the Left-Handed coordinates X and Z Axes form the horizontal plane, and Y Axis is always up - YDirection = [0, 1, 0].
It is helpful to think of the 3D world as a 2D Chart with X and Y axes plus addition of Z-Axis which goes "into the screen".
SciChart also allows you to render SciChartSurface3D world in Right-Handed coordinate system - RHS. It is easily switchable via the isLeftHandedCoordinateSystem property:
surface.getViewport3D().setIsLeftHandedCoordinateSystem(false);
World Coordinates
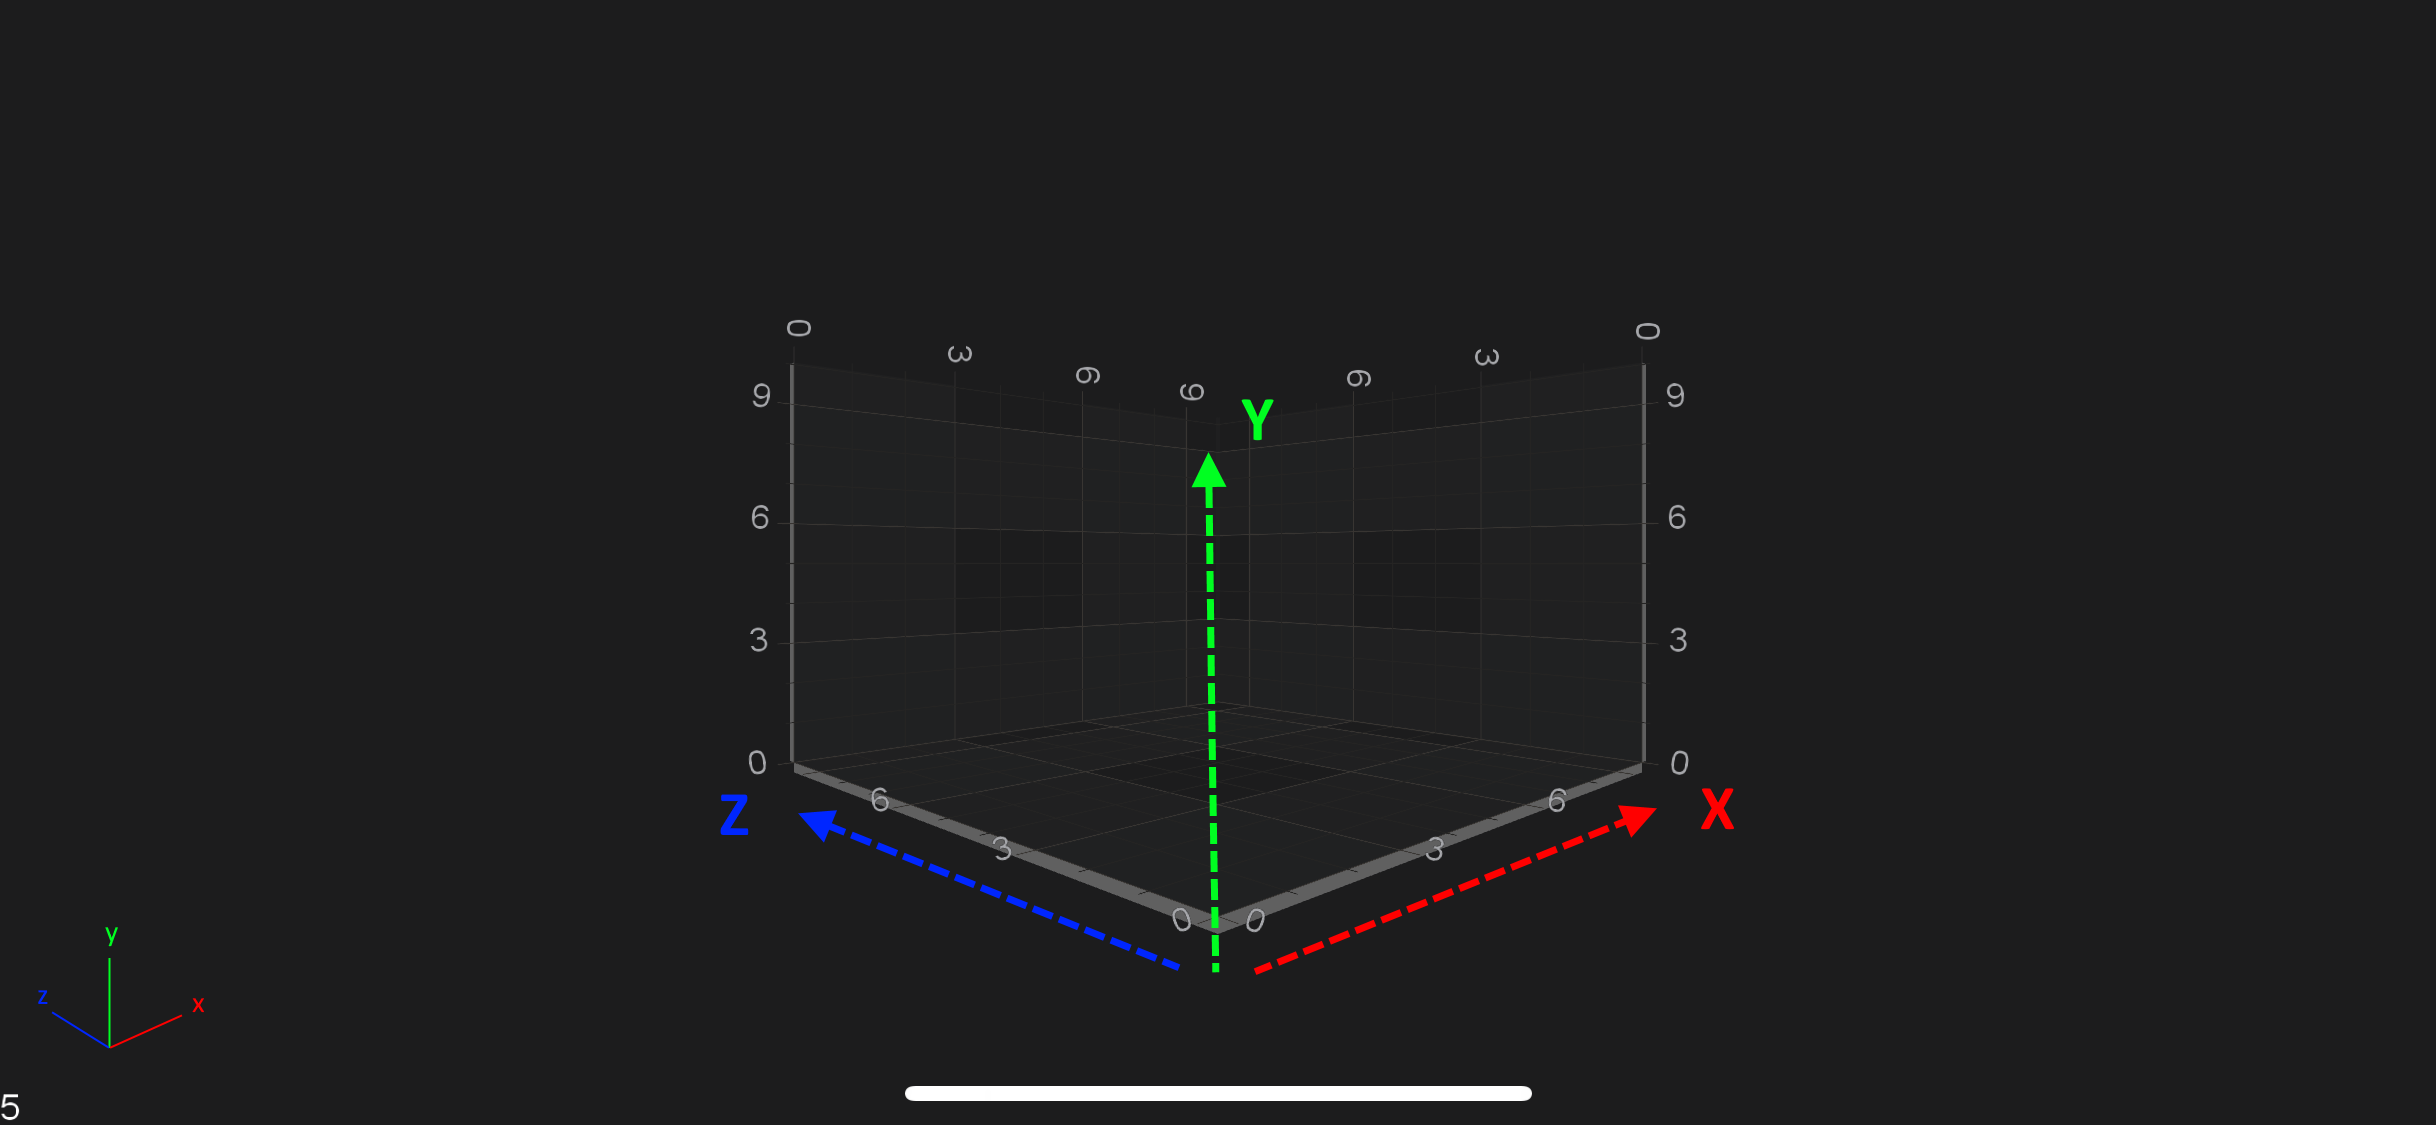
World Coordinates is the term used to describe coordinates in the 3D World. These are the raw [X, Y, Z] coordinates of a vertex.
By default, the origin [0, 0, 0] is in the center of the bottom plane of the chart.
The box in the chart is called the AxisCube. The AxisCube size is defined by the worldDimensions property,
which is a single Vector3 with [X, Y, Z] sizes and defines the size of a cube as follows:
Therefore, size of the AxisCube in [X, Y, Z] is extends like below:
| Direction | Extends like |
|---|---|
X-Direction |
[-worldDimensions.getX() / 2; worldDimensions.getX() / 2] |
Y-Direction |
[0; worldDimensions.getY()] |
Z-Direction |
[-worldDimensions.getZ() / 2; worldDimensions.getZ() / 2] |
Note
By default the worldDimensions is initialized with [X = 300, Y = 200, Z = 300]
To change the worldDimensions property, simply provide it with the Vector3 (3-component vector) like below:
surface.getWorldDimensions().assign(200, 200, 200);
Data Coordinates
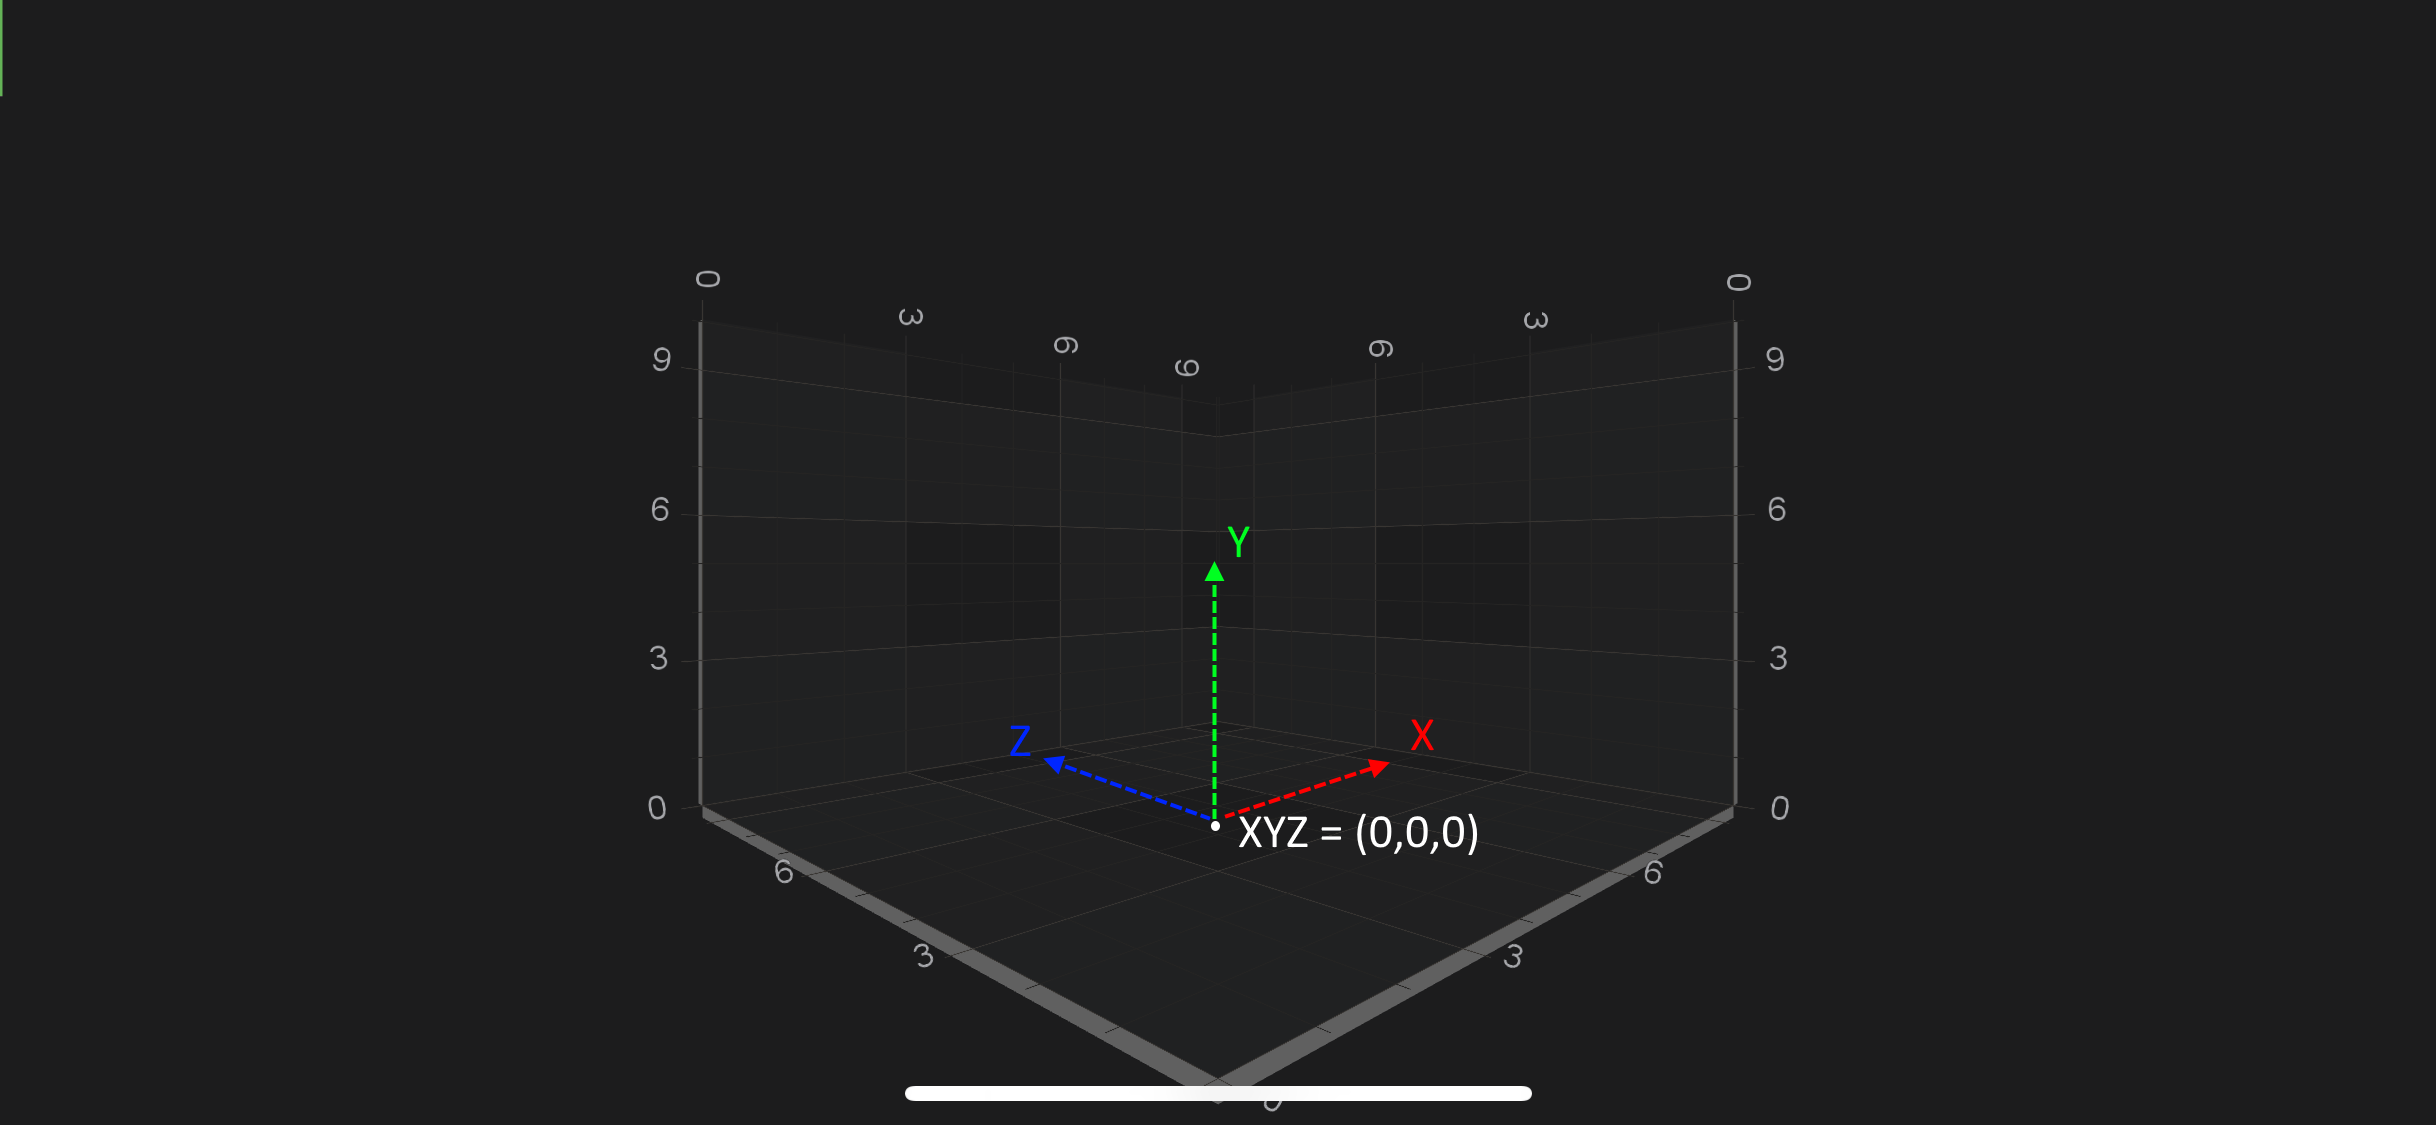
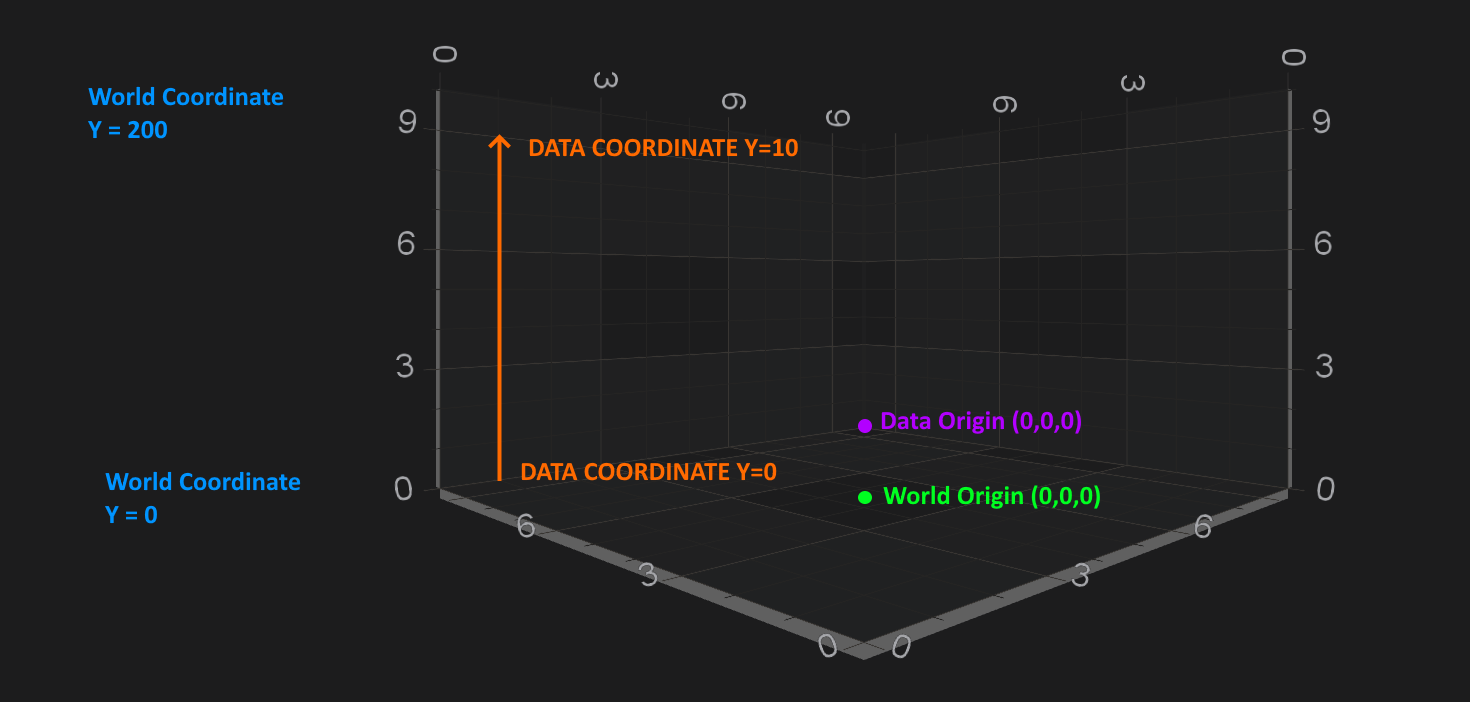
By contrast to the WorldCoordinates, which are absolute coordinates in the 3D World, in SciChart 3D there is the concept of Data Coordinates.
Data Coordinates are measured on an IAxis3D instance, for example, the Y-Axis (which is UP) might have a size of 200 in the World Coordinates, but might display a VisibleRange of [0...10].
Therefore, Data which falls int he range [0...10] will be spaced on this axis from [0...200] World Coordinates.
The difference between World and Data Coordinates is shown in the following example:
Converting from World to Data Coordinates
The conversion between Data Coordinates and World Coordinates is done by the IAxis3D. It's no different to 2D conversions which is described in the Axis APIs - Convert Pixel to Data coordinates article.
You can find simple example how to do the conversions for NumericAxis3D below.
final NumericAxis3D xAxis = new NumericAxis3D();

ICoordinateCalculator calculator = xAxis.getCurrentCoordinateCalculator();
float coordinate = calculator.getCoordinate(1.2);

// Convert back:
double dataValue = calculator.getDataValue(coordinate);